Briefly, the program calculates the distribution of fiber modes by solving the overall model.
The script program needs to define the refractive index distribution value. Through several lines of program code, read the refractive index value in turn, and interpolate to draw the refractive index function n_f(r) graph.
The following is the related graphics of the optical fiber mode characteristics after the program is run:
Figure 1 is a radial function graph, and different color curves correspond to different values of ι. The figure also shows the refractive index distribution and the effective refractive index of the mode.
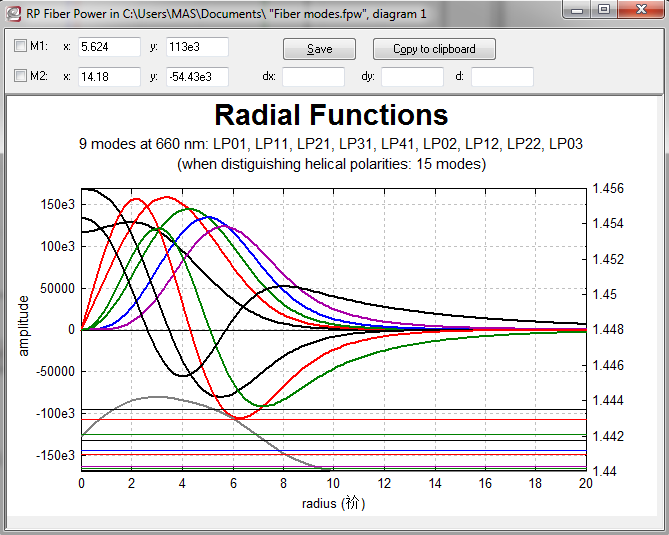
radial function graph
Figure 2 shows the intensity distribution pattern of the selected mode.
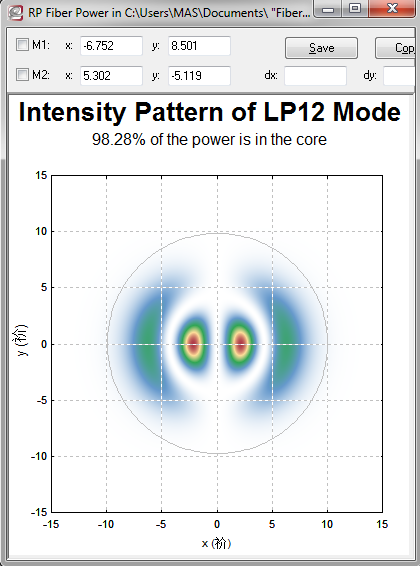
intensity distribution pattern of the selected mode
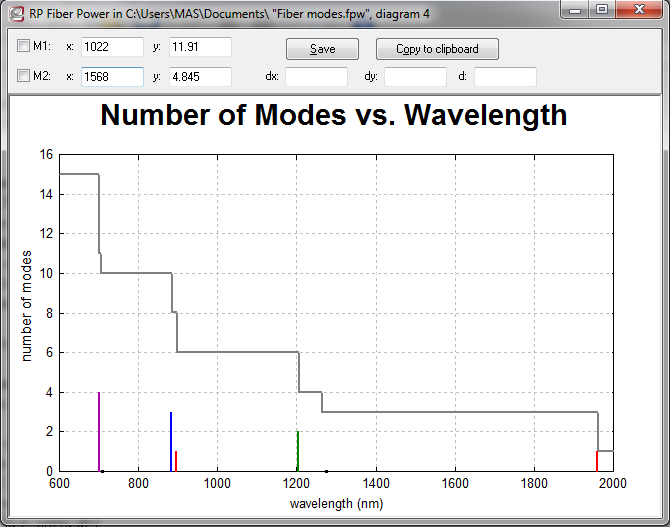
Figure 3 shows the relationship between the number of modes and the wavelength. When the wavelength is 1.96um, only single-mode form exists.
the relationship between the number of modes and the wavelength
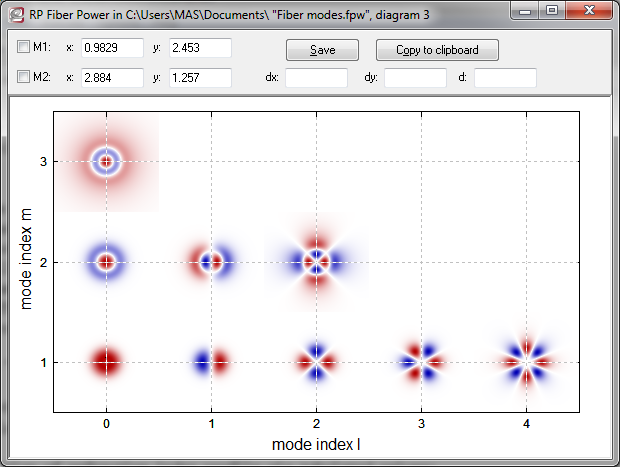
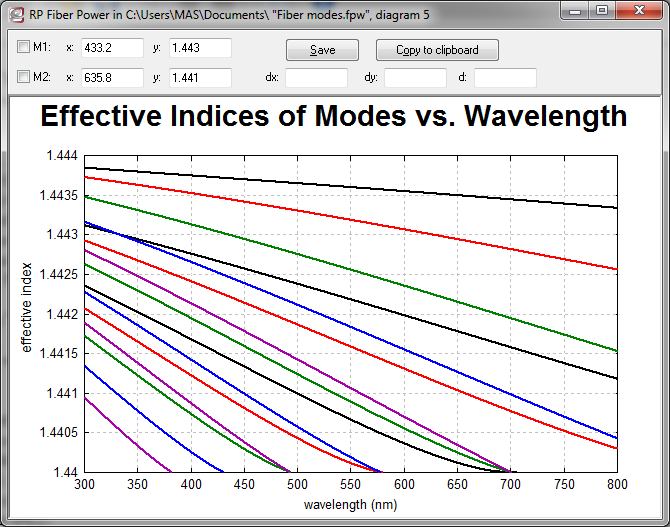
Figure 4 shows that the effective refractive index is related to the wavelength, and when the refractive index increases to the size of the cladding refractive index, it corresponds to the cut-off wavelength.
the effective refractive index is related to the wavelength
Figure 5 shows the power corresponding to all modes and wavelengths in the core.
power corresponding to all modes and wavelengths in the core